
AI Use Cases for MSPs With Connected Data
This article has been written by Tim Hickle
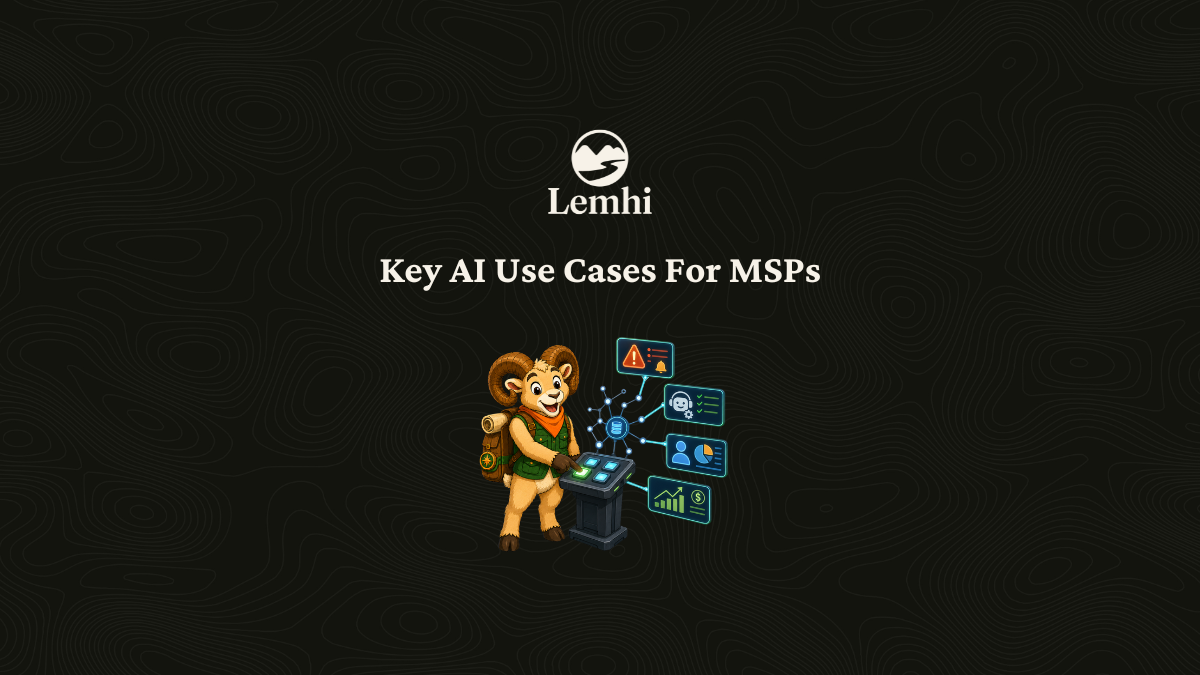
Most MSPs have the data. The problem is that it lives in six different places. Your PSA holds ticket history. Your RMM holds device telemetry. Your finance tool holds project actuals. Your spreadsheets hold the rest. When those systems do not talk to each other, AI has nothing useful to work with, and the "AI-powered insights" vendors keep promising stay firmly in the category of theoretical.
The shift happens when you centralize that data into a unified structure, often called a data lakehouse, where your PSA, RMM, billing, documentation, and project management data all land in one queryable environment. At that point, AI stops being a feature you demo and starts being an operational capability you run. The use cases below are not speculative. They are queries and workflows MSPs are running right now against connected data, and they are delivering real business value.
If you have been waiting to understand what AI would actually do for your MSP once your data infrastructure is in place, this is that answer.
QBR Preparation in Minutes, Not Hours
Quarterly business reviews are one of the highest-value client touchpoints an MSP has, and they are also one of the most labor-intensive to prepare. Pulling together ticket volume trends, resolution times, open risks, project statuses, and budget summaries across a single client account can take a technician or account manager two to four hours per client. For a 50-client book of business, that math gets painful fast.
With centralized data, a well-constructed AI query can pull every relevant data point for a given client and generate a structured QBR summary in seconds. You specify the client, set the date range, and define the output format. The AI cross-references ticket data, device health trends, project progress, contract utilization, and any flagged escalations to produce a first draft that a human reviews and refines, rather than builds from scratch.
The output is not just faster. It is more consistent. Every client gets the same analytical depth regardless of which account manager owns them. That consistency matters when you are trying to scale a high-quality client experience without adding headcount proportionally.
Churn Risk Scoring Across Your Client Base
Client churn is expensive, and the warning signs are almost always visible in retrospect. The client who left six months ago probably showed elevated ticket escalation rates, reduced engagement scores, and a stalled project in the three months before they canceled. Without a unified view of those signals, no one saw the pattern until it was too late.
Connected data makes proactive churn risk scoring possible. You can build a scoring model that weights factors like ticket sentiment trends, response time complaints, missed SLA instances, contract renewal proximity, and executive engagement cadence. Run that model across your entire client base and you get a ranked list of accounts by churn risk, updated on whatever frequency makes sense for your business.
This is not just about retention. It is about resource allocation. When you know which clients are at risk, you can direct account management attention where it will have the most impact. You can also trigger automated check-ins or escalation reviews for clients crossing a risk threshold, rather than waiting for the call that tells you they are leaving.
Technician Performance Anomaly Detection
Managing technician performance at scale is difficult without good data. Most MSPs track basic metrics like ticket volume and average resolution time, but those surface-level numbers miss the patterns that actually matter. A technician who closes tickets quickly but generates high rates of repeat issues is creating hidden costs. A technician whose resolution times have increased significantly over the past 30 days may be dealing with a skill gap, a tooling problem, or something worth a quiet conversation.
With centralized data, you can run anomaly detection queries that surface these patterns automatically. Rather than reviewing every technician's metrics manually each week, you set a baseline, define acceptable variance, and let the AI flag deviations. A technician whose ticket reopen rate has jumped 40 percent in the last two weeks gets flagged for review. A technician who is consistently resolving a specific category of issue faster than their peers gets identified as a potential trainer or documentation contributor.
The goal here is not surveillance. It is informed management. Your operations lead cannot monitor every ticket. Anomaly detection gives them a prioritized list of what actually warrants attention, which makes coaching conversations more targeted and performance management more fair.
Real-Time Project Budget and Scope Visibility
Project overruns are one of the most consistent margin killers in MSP businesses. They often do not surface as overruns until the project is already over, because no one had a live view of hours consumed versus hours budgeted at the task level. By the time the project manager notices the burn rate problem, there are two weeks left and nothing left in the budget.
Centralizing your project management, time tracking, and billing data creates the foundation for real-time budget status queries. You can ask a question like "which projects are currently tracking to exceed their budgeted hours by more than 15 percent" and get an answer that reflects the current state, not last week's export. You can set up automated alerts when a project crosses a budget threshold, giving project managers a window to intervene before the overrun is locked in.
This same data connection also supports better estimating over time. When historical project actuals sit alongside original estimates, you can analyze where specific project types consistently run over, which engineers tend to estimate accurately, and which clients tend to generate scope creep. That institutional knowledge stops living in someone's head and starts informing your next proposal.
Client Escalation Readiness Scoring
When a client situation escalates to the executive level, your team needs to walk into that conversation fully prepared. They need to know the history of open issues, what was promised and when, which tickets are aging, and whether any contractual commitments are at risk. Without centralized data, assembling that picture means pulling from multiple systems under pressure, often right before the call.
Escalation readiness scoring solves this by maintaining a continuously updated view of each client's escalation posture. You define the signals that indicate a client is moving toward an executive escalation, things like a cluster of high-severity tickets, a pattern of after-hours contacts, or a spike in direct emails to your leadership team. The AI monitors those signals and generates a readiness brief automatically when a client crosses a threshold.
Preventing an escalation is always better than managing one. That brief gives whoever takes the call the context they need without the scramble, and it gives your team the opportunity to reach out proactively before the client feels the need to escalate at all.
The Infrastructure Is the Prerequisite
Every use case described above requires the same foundation: your data has to be connected, structured, and queryable. None of this works with siloed systems and manual exports. The AI does not create the insight. It surfaces insight from data that is already there. Your job is to make sure that data is in a place where AI can reach it consistently.
Once that infrastructure is in place, these use cases are not one-time projects. They are repeatable, scalable operational capabilities that compound over time as your data history grows. QBR prep gets faster. Churn risk models get more accurate. Technician performance baselines get more precise. The MSPs who build this foundation now are the ones who will be operating at a fundamentally different level two years from now.
Scale AI transformation across your entire book of business.
Most MSPs are stuck selling AI as scattered projects, Copilot rollouts, or one-off workshops. The MAGIC Framework gives you a repeatable path to package, sell, deliver, and manage AI Transformation as a Service across your client base.
For MSPs ready to turn AI demand into a managed service motion.
MSP Data Lakehouse FAQ
Practical answers for MSP leaders centralizing operational data and turning it into useful AI workflows, reporting, and decision support.
Do I need a data engineer to build a data lakehouse for my MSP?
Not necessarily. Modern platforms offer prebuilt connectors for common MSP systems such as ConnectWise, Autotask, HaloPSA, and Datto. A dedicated data engineer can accelerate the work and support deeper customization, but an MSP can build a functional unified data environment using low-code tools without a full-time engineering resource. Complexity increases with the number of systems involved and the specificity of your data requirements.
How much historical data do I need before AI use cases start returning useful results?
It depends on the use case. QBR preparation and project-budget visibility can produce value with three to six months of recent data. Churn-risk scoring and anomaly detection generally improve with 12 to 24 months of history because they need enough information to establish meaningful baselines. Start building the infrastructure now, then allow the models to improve as the historical dataset grows.
Are these use cases only viable for large MSPs with significant resources?
No. Mid-market MSPs managing 30 to 100 clients are already running workflows like these. Their value comes from giving smaller teams analytical capacity that previously required a much larger organization. For an MSP with limited account-management bandwidth, churn-risk scoring and escalation readiness may be even more valuable than they are for a larger provider with a dedicated client success team.
Which PSA and RMM platforms integrate most easily with centralized data environments?
ConnectWise Manage, Autotask, and HaloPSA have documented APIs that many integration platforms support. Datto RMM and NinjaRMM are also commonly connected on the RMM side. The more important question is not simply whether a platform has an API, but whether it exposes operational data in a structure that supports analysis. Some systems provide relatively clean data, while others require significant transformation before the information is useful.
What is the first use case I should build once my data is centralized?
Start with QBR preparation. It creates an immediate and visible time-saving benefit, does not require a complex predictive model, and helps build internal confidence in the data infrastructure. When the team sees a two-hour preparation process reduced to roughly 20 minutes, it becomes easier to secure support for more advanced use cases such as churn scoring and anomaly detection.